Hazard sign and magnifying glass icon

Understand Exposure

Assets include the people, infrastructure, and natural systems your community wants to protect. 

Hazards are events or conditions that could injure people or damage assets. 

Exposure occurs wherever assets and hazards overlap. 

Read Full Summary
Hazard sign and magnifying glass icon

Understand Exposure

Photo of classroom with projector screen

Capture an inventory of the things your community cares about

What are the tangible and non-tangible things your community depends on to keep functioning? Make a detailed list of the people, places, and things you want to protect from climate-related hazards. These are your community’s assets.
 

  • What natural features, historic sites, schools, tourist attractions, or retail centers make your community special?
  • Which industries and companies support a significant number of jobs?
  • What transportation infrastructure (roads, bridges, ports, light rail, etc.) do people and businesses depend on to move people and goods through the community?
  • What special events draw visitors to your community?
  • Check your list against our list of assets.

Depending on the size of your community, you may not be able to consider each individual building or piece of infrastructure on its own. In this case, you can group similar assets together to help you move forward.
 

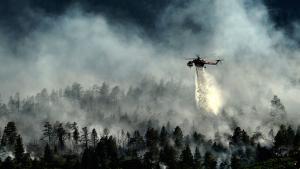
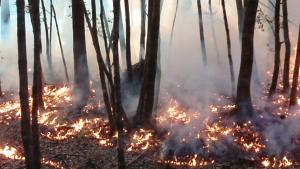
WIldfire

List the weather and climate-related hazards that could occur in your community

Flooding, drought, landslides, wildfire, high winds, and extreme heat are common climate-related hazards. Check for more on our full list of hazards.

Make a list of all the climate-related hazards that could occur in your region. What hazards have occurred in the past? What hazards might occur in the next year or so? What hazards might occur under future conditions over the next several decades? 


Start with hazards that have occurred in your region in the past

Draw on local knowledge, newspaper archives, and online tools to identify extreme weather events that occurred within your region in the past. Capture a few bullet points about each event and its impacts. 

Example: In the fall of 1994, after five days of heavy rain, debris clogged the stormwater system and 16 homes at the lower end of Elm street flooded.

Explore past storms in the Storm Reports Database

Which hazards might occur in the next few years?

Check if trends in temperature and precipitation suggest an increasing chance of hazards such as heat waves, drought, or flooding occurring in your region. Capture brief descriptions of hazards or events your community may face.

Check maps and graphs of recent temperature and precipitation trends for your county

View climate trends in State Climate Summaries

View real-time climate hazards and the number of people currently exposed to them 

Which hazards might you face over the next several decades?

As temperatures rise and precipitation patterns change over this century, which new hazards might occur in your region? List hazards you might expect to occur under conditions projected for the future.

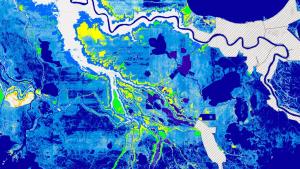
Check current and future exposure in the Climate Mapping for Resilience and Adaptation portal

Visit the Toolkit's Climate Explorer tool offers climate projections for all counties in the United States

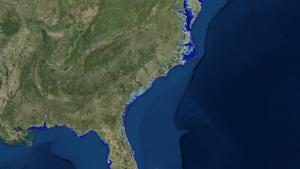
Check if rising sea levels could impact your region

As global sea level rises, will it affect land in your region? If so, capture a brief description of the frequency and depth of coastal flooding projected for the future.

Check future shoreline locations in the Sea Level Rise Viewer

Exposure matrix

Transfer your assets and hazards into an exposure matrix

  • In a spreadsheet, list your assets in the first column on the left
  • Enter your potential hazards along the top row. 
  • At each cell in the matrix, consider if the asset could be damaged by the hazard.

This deliberate exercise can help you move from vague worries about extreme weather to a specific list of concerns that you may be able to address.
 

  • Open a blank spreadsheet, or use a piece of lined paper. 
  • List your community assets in the first column on the left.
  • Across the top row, enter each hazard that could occur in your location
  • Start with your first asset and work across the row: Consider if the asset could be damaged by the hazard at the top of each column. 
    • If the asset could be damaged by the hazard, put an X in the cell to indicate the asset is exposed.
    • If the asset wouldn't be damaged, leave the cell blank.
  • Work across the row for each asset, one at a time.

When you're done, the cells with an X define your list of assets that are exposed to each climate-related hazard.

You can find additional worksheets and examples to help with this task in the Practitioner's Guide Resources below.